Core Unit 4 - Patterns in resource consumption
Case Study - Deepwater Horizon Oil Spill based on geographypods.com
Task 1 - Read the following handout and answer questions 1-5.
Task 2 - Now that you have a basic idea of what happened, you will need to build a case study about this oil spill. Use the attached links and videos to help you create a PowerPoint presentation that covers:
Links
Time Magazine- excellent source
BP Oil Spill collection of articles at the Guardian
Coverage from the Huffington Post
the BBC and their articles
NY Times Interactive resource - excellent source
Task 1 - Read the following handout and answer questions 1-5.
Task 2 - Now that you have a basic idea of what happened, you will need to build a case study about this oil spill. Use the attached links and videos to help you create a PowerPoint presentation that covers:
- What happened? descriptive, using news and other footage as evidence
- When and where did it happen? include a range of maps
- Who was involved? during and after the accident
- Why did it happen? legal and moral responsibility
- What is the impact of this event? environmental impact and implications for the future of offshore oil production
Links
Time Magazine- excellent source
BP Oil Spill collection of articles at the Guardian
Coverage from the Huffington Post
the BBC and their articles
NY Times Interactive resource - excellent source

|
Topic 3 - Oil Production & Consumption adapted from GeographyPods
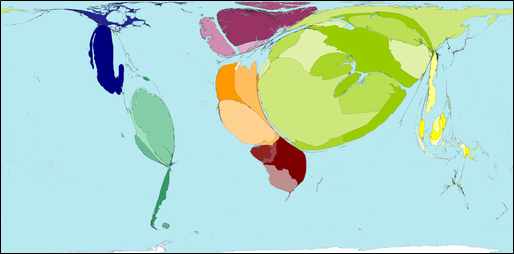
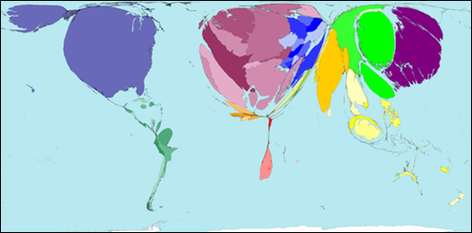
Objective: To analyse the global patterns and trends in the production and consumption of oil. Starter - Watch the first video to the right "Oil Addition/GOOD". List three ideas that you have learnt/remember from it. Task 1 - Watch the videos embedded to the right. Ensure that you take notes from each under the following headings: i. CNN Global Oil Reserves - Where does our oil come from now? ii. Oil Production Has Peaked - How have the patterns and trends of global oil consumption changed in recent years? Make notes on this worksheet. **3.00 - Make a sketch of the Hubbert's Peak graph on your sheet and annotate with data from the video** "The better you do the job of exploiting oil and gas, the sooner that it is gone" iii. Quatar Rides The Oil Boom - How do oil & resources help development? Then check out this GapMinder chart. Task 2 - Study the two inflated/deflated maps below. Take a copy of each and then add titles. (Click on each to enlarge) 1. Shows Crude Petroleum Exports 2. Shows Crude Petroleum Imports Which one is which? Use evidence from the maps and your own knowledge and understanding to explain the differences making reference to specific regions and distortion shapes. |
|
Task 3 - Go to the following pages and complete the activities:
a. Click here to be taken to a Wikipedia list of top oil producing nations. Alter the list by clicking on the sort arrow for 'Production bbl/day. Make a notes of the top 5 countries in terms of their production and the value for each. Is there a pattern in terms of geographic location?
b. On the same page, alter the 'Consumption bbl/day' tab so that it shows the biggest consumers. Make a note of the top 5 consuming countries. Are there any patterns that can be linked to population and development? Are there major disparities between the consumers and what they produce?
Topic 2 - Malthusian views continued
Review - Short Response Exam Questions
Describe what is meant by a neo-Malthusian view.
Describe what is meant by an anti-Malthusian view.
Review - Short Response Exam Questions
Describe what is meant by a neo-Malthusian view.
Describe what is meant by an anti-Malthusian view.
Extended Exam Response
Contrast the two opposing views of the relationship between population size and resource consumption.
Use the attached essay planning sheet.
Contrast the two opposing views of the relationship between population size and resource consumption.
Use the attached essay planning sheet.
Topic 2 - Neo-Malthusian vs. Anti-Malthusian views adapted from Geographypods
Objective: To be able to discuss the two opposing views (neo-Malthusian and anti-Malthusian) of the relationship between population size and resource consumption.
Task 1 - Compare & Contrast
Create a table with the headings Malthusian/Neo-Malthusian/Anti-Malthusian. Using the videos linked below, the attached PowerPoint and the websites linked, complete the table.
You should ensure that you have:
- associated people
- background/history
- basic concepts & beliefs
- relationship between population size & resource consumption
- issues & controversies
Websites:
Malthus Theory - How Stuff Works
Paul Erlich
Club of Rome
Ester Boserup
BBC Bitesize - Global consumption theories
Task 2 - Make a note of the following key terms.
Preventative checks: These are measures taken by humans to reduce shortages. This might be reducing population through better family planning and possibly anti-natalist policies. Or it could be reducing waste e.g. through better recycling.
Positive checks: Despite their name, they are actually more negative solutions to resource shortages. These might be fighting and war or massive famines which actually reduce the overall population and therefore demand.
Neo-Malthusian: This is an idea of thought that follows Malthus's ideas. Paul Ehrlich and the ''Club of Rome" both have Neo-Malthusian ideas.
Anti-Malthusian: Anti-Malthusian is simply the school of thought that disagrees with Malthus's pessimism and is more aligned to Boserup's optimism i.e. that humans will always find solutions to shortages.
Task 3 - Draw a graph to illustrate each of the theories. The graph for Neo-Malthusian theory is found below. Include a caption which explains the main relationships.
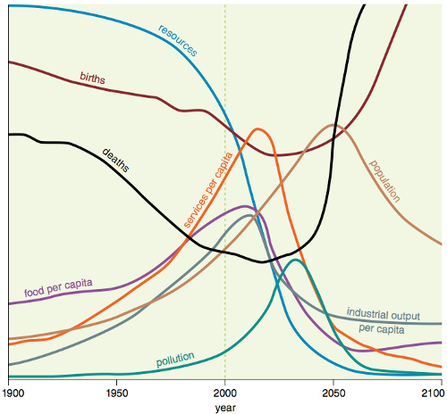
The limits to growth model
Extension - watch this video about managing change with Jared Diamond.
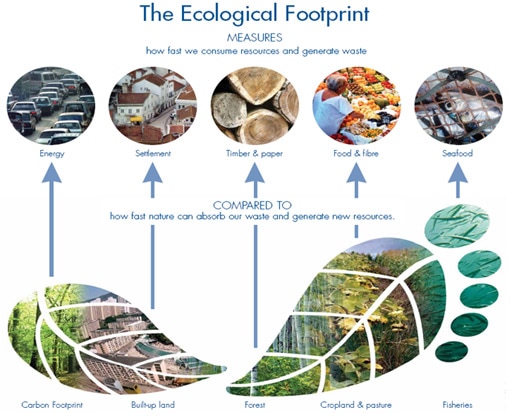
Topic 1 - Ecological Footprints adapted from GeographyPods
Ecological Footprint [according to the IB]: The theoretical measurement of the amount of land and water a population requires to produce the resources it consumes and to absorb its waste under prevailing technology.
Objective: To be able to evaluate the ecological footprint as a measure of the relationship between population size and resource consumption.
Introduction - Watch these videos on ecological footprint.
The Ecological Footprint: Accounting for a Small Planet
UAE Ecological Footprint Animation
Ecological footprint: Do we fit on our planet?
Task 1 - Take the WWF Footprint calculator to work out your approximate impact on the planet.
How did you do? What features caused your footprint to be bigger or smaller than your peers in the class?
Task 2 - Using the three maps linked below write a commentary of less than 100 words describing and then 100 words explaining the global disparities in ecological footprint values. Are there any surprises?
Map 1; Map 2; Map 3
Task 3 - Complete this quiz sheet. Match each of the IB Five to the data sets within. Remember they are China, Niger, Brazil, USA & Australia.
Task 4 - Using your textbook and internet research answer these questions:
Ecological Footprint Questions
Extension - Watch this video about the way to a sustainable future.
Ecological Footprint [according to the IB]: The theoretical measurement of the amount of land and water a population requires to produce the resources it consumes and to absorb its waste under prevailing technology.
Objective: To be able to evaluate the ecological footprint as a measure of the relationship between population size and resource consumption.
Introduction - Watch these videos on ecological footprint.
The Ecological Footprint: Accounting for a Small Planet
UAE Ecological Footprint Animation
Ecological footprint: Do we fit on our planet?
Task 1 - Take the WWF Footprint calculator to work out your approximate impact on the planet.
How did you do? What features caused your footprint to be bigger or smaller than your peers in the class?
Task 2 - Using the three maps linked below write a commentary of less than 100 words describing and then 100 words explaining the global disparities in ecological footprint values. Are there any surprises?
Map 1; Map 2; Map 3
Task 3 - Complete this quiz sheet. Match each of the IB Five to the data sets within. Remember they are China, Niger, Brazil, USA & Australia.
Task 4 - Using your textbook and internet research answer these questions:
Ecological Footprint Questions
- What is a nation's ecological footprint?
- How is a 'carbon footprint' different from an 'ecological footprint'?
- What is a nation's biocapacity?
- Why might the biocapacity of a nation decrease?
- Why might the ecological footprint of a nation increase?
- Create a table that describes the relationship between the ecological footprint and biocapacity in the seven countries listed below.
- Is there a link between population size [use the CIA World Factbook] and the ecological footprint?
- Evaluate the ecological footprint as a measure of the relationship between population size and resource consumption.
Extension - Watch this video about the way to a sustainable future.
