Patterns & Change - Gender & Change Introduction
Starter Task - Take the Gender Inequality test by clicking here. Discussion should follow in the class regarding most equal / least equal societies represented in the class.
Task 1
a. Watch the video above and make notes on the what the Gender Inequality Report tries to do. Then download and read over this information sheet to ensure that you know how the index is calculated.
b. Click here to be taken to the most recent global summary of findings from the report. Use three of the graphics within as a stimulus for a 100 word summary of progress made. Focus should be on comparative progress since 2006 where possible.
Task 2 - use this league table to note the top 5 (least gap) & bottom 5 (biggest gap) countries with their values as indicated on the interactive map above.
Task 3 - Now see if you can find a reputable news story about a gender equality related issue for one of the top and one of the bottom placed countries. Highlight, print out and keep with this pack of work.
Patterns & change - internal migration
Want to read about this? Here are some links:
BBC - China's workers return to cities
Wall Street Journal - China Fears Restive Migrants
The Guardian - Interviews with Chinese workers
Wall Street Journal - On the Move
Financial Times - In Depth Series on China's workers
BBC - China's workers return to cities
Wall Street Journal - China Fears Restive Migrants
The Guardian - Interviews with Chinese workers
Wall Street Journal - On the Move
Financial Times - In Depth Series on China's workers
Patterns & change - external migration (based on geoggraphypods)
Objective: Evaluate international migrations in terms of their geographic (socio-economic, political and environmental) impacts at their origins and destinations.
Task 1: Check out this site. It shows how external migration into different USA states has changed in the last 100 years. Write a brief commentary paragraph that explains what changes have occurred.
Task 2: Remittances and the economic impact of migration. Click here to be taken to an article covering the issue of remittances between the USA & Mexico. Read the first three paragraphs and complete the following:
i. What is a remittance?
ii. How much money is sent back from the USA to Mexico annually?
iii. Where in the ranking of 'most important industries' does remittances come?
Task 3: Take notes on the presentation on the Mexico-USA migration.
Task 4: Use the resources provided to research the impact of this migration. Aim to provide at least one statement/fact/statistic for each square of the graphic organiser.
Homework: Based on your research offer some analysis: Are migrants from Mexico a positive influence in the US? Support with specific examples.
PATTERNS & CHANGE - MIGRATION (based on geographypods)
Objective: To know and understand our key terms and definitions for this unit of work.
Task 1: Study the Graphic below which summarises some terms for you. Refer to this throughout the chapter.
Task 1: Study the Graphic below which summarises some terms for you. Refer to this throughout the chapter.

Task 2: Use the this sheet and your research skills on the internet to record and summarise migrations for the countries specified. Use a news site such as Google News or BBC News to find a migration related news story for each of the countries. Again, you may want to use this graphic to help you out.
Homework:
Study the embedded presentation attached entitled IB Geography Migration Models. Refresh your knowledge by studying slides 1-6. Make notes on the five main features of Ravensteins Model of Migration (slide 10-12). What are the limitations of using this model?
Make a copy of the 'Step Migration' model on slide 13 and 'Circular Migration' on page 15.
Extra Resources:
Choose your own Adventure - Syrian Refugee Journey
Changing Geography of International Migration
My Life as An Undocumented Worker
International Migrants Day
PatterNs & change - High & low fertility rates
Objective: Analyse the impacts of a youthful population.
Task: Using the videos and articles provided, make notes on the impacts of a youthful population, consider both the advantages and disadvantages to the population.
Article – Africa’s rising youth
Article - Is Africa’s youth population a risk or asset
Iran
Article – Iran’s frustrated generation
Article – Youth shapes Iran’s economy
Article – Children of Iranian revolution need change
Objectives: Analyse the impacts of an ageing population.
Task: Using the videos and articles provided, make notes on the impacts of an ageing population, consider both the advantages and disadvantages to the population.
Video - How an ageing population will change the world
Article - 5 Ways Countries Tried to Increase Birth Rates
Article - Ageing populations and fewer workers place strain
Article - The end of retirement
Article - Centenarians increase five fold
Article - UN warns over impact of ageing population
Japan
Article - Fabric of a long life
Article - Fears over Japan/s ageing population
Article - Solving Japan's age-old problem
Article - Japan's pensioners still contribute
Video & Article - Who will look after Japan's elderly
England
Video & Article - The town thronged with old people
China
Article - Ageing China
Video & Article - China faces timebomb
Article - China's ageing population and its impacts
Patterns & Change - Populations in Transition
Population Momentum (adapted from geographypods)
Watch the YouTube video below and answer the following eight questions:
1. What does a demographer do?
2. Outline what will happen to the population of Uganda by 2050 and 2067?
3. What is this population number based on?
4. What is the current fertility rate in Uganda?
5. What are the three variants and what do they assume in Uganda's case?
6. Why is predicting a projection for a currently fast growing population tricky? Outline and the four principles.
7. What does the world population projection graph show for future growth?
8. What confuses projections for the future?
Population Trends & Patterns (adapted from geographyalltheway)
Words to Know:
natural increase
fertility rate
life expectancy
neonatal
infant mortality rate
child mortality rate
'the west'
'emerging economies'
The aim of this lesson:
Starter Activity: Which country has the highest child mortality [probability of dying between birth and exact age 5 - expressed as deaths per 1,000 births] out of the following pairs? To find out watch the video linked directly below the image.
Words to Know:
natural increase
fertility rate
life expectancy
neonatal
infant mortality rate
child mortality rate
'the west'
'emerging economies'
The aim of this lesson:
- To start the process of being able to explain population trends and patterns in births (Crude Birth Rate), natural increase and mortality (Crude Death Rate, infant and child mortality rates), fertility and life expectancy in contrasting regions of the world.
Starter Activity: Which country has the highest child mortality [probability of dying between birth and exact age 5 - expressed as deaths per 1,000 births] out of the following pairs? To find out watch the video linked directly below the image.

Task One: Understanding what we need to know
You need to be able to explain population trends and patterns in births (crude birth rate), natural increase and mortality (crude death rate, infant and child mortality rates), fertility and life expectancy in contrasting regions of the world.
Define: explain what these words mean | trends | patterns | regions
You will require a printed copy of the worksheet - so that you can define the indicators, plot the data and then describe and explain the trends and patterns.
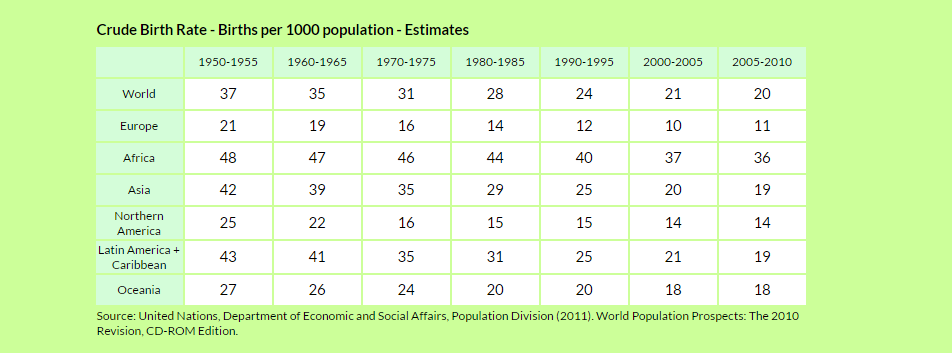
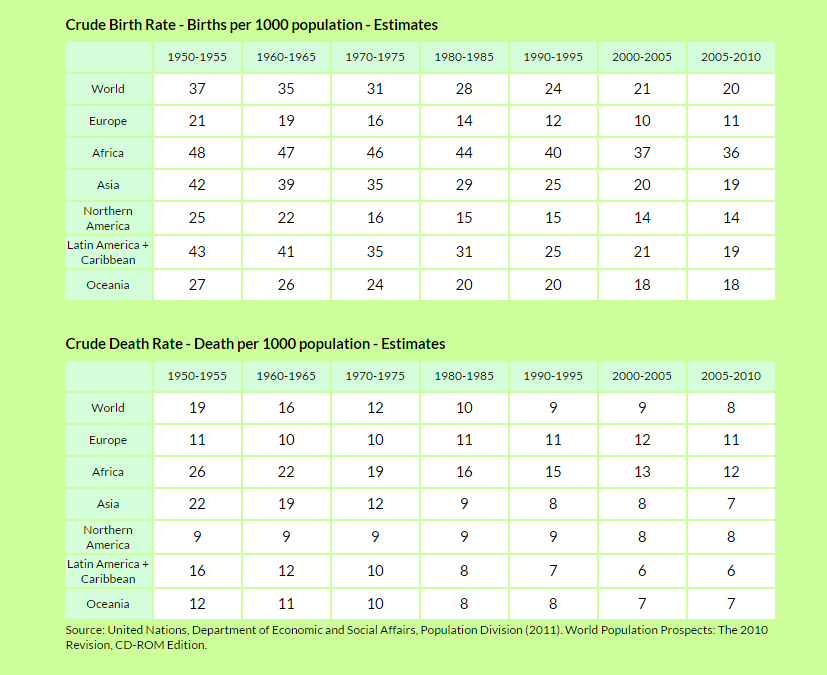
Task Two: Births [crude birth rate]
Plot the data on your worksheet, describe the trends, describe the patterns, try to explain the trends and then try and explain the patterns. After watch the following video.
You need to be able to explain population trends and patterns in births (crude birth rate), natural increase and mortality (crude death rate, infant and child mortality rates), fertility and life expectancy in contrasting regions of the world.
Define: explain what these words mean | trends | patterns | regions
You will require a printed copy of the worksheet - so that you can define the indicators, plot the data and then describe and explain the trends and patterns.
Task Two: Births [crude birth rate]
Plot the data on your worksheet, describe the trends, describe the patterns, try to explain the trends and then try and explain the patterns. After watch the following video.
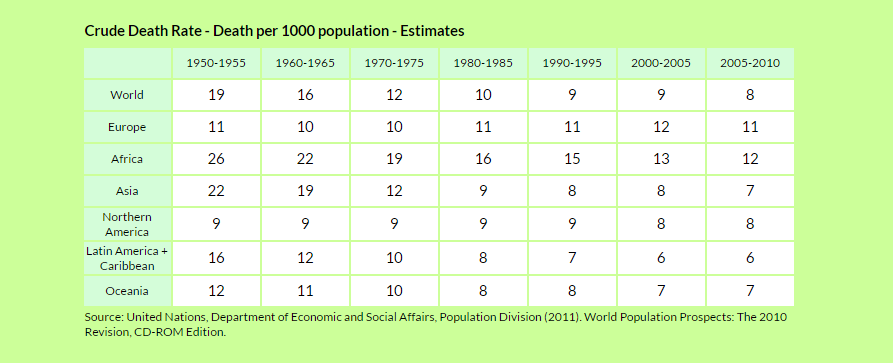
Task Three: Deaths [crude death rate]
Plot the data on your worksheet, describe the trends, describe the patterns, try to explain the trends and then try and explain the patterns. Then have a read of this related news article.
Plot the data on your worksheet, describe the trends, describe the patterns, try to explain the trends and then try and explain the patterns. Then have a read of this related news article.
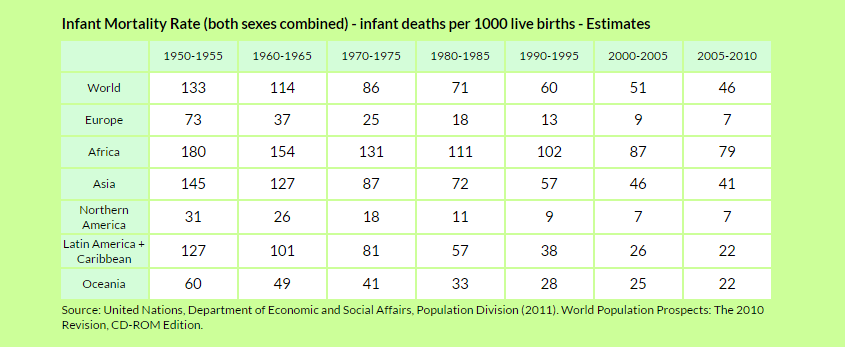
Task Four: Infant Mortality Rates
Plot the data on your worksheet, describe the trends, describe the patterns, try to explain the trends and then try and explain the patterns. The have a read of this related news article.
Plot the data on your worksheet, describe the trends, describe the patterns, try to explain the trends and then try and explain the patterns. The have a read of this related news article.
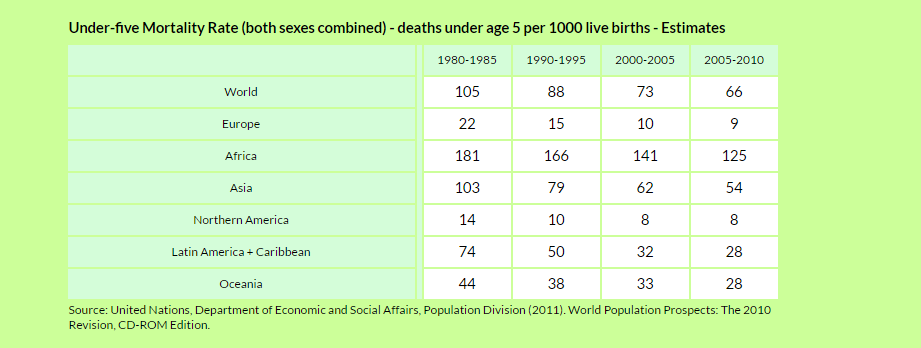
Task Five: Child Mortality Rates
Plot the data on your worksheet, describe the trends, describe the patterns, try to explain the trends and then try and explain the patterns. Then have a read of this related news article.
Plot the data on your worksheet, describe the trends, describe the patterns, try to explain the trends and then try and explain the patterns. Then have a read of this related news article.
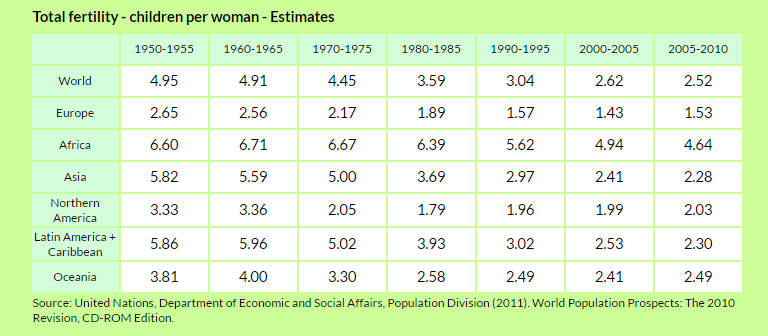
Task Six: Fertility Rates
Plot the data on your worksheet, describe the trends, describe the patterns, try to explain the trends and then try and explain the patterns. The watched the related video below.
Plot the data on your worksheet, describe the trends, describe the patterns, try to explain the trends and then try and explain the patterns. The watched the related video below.
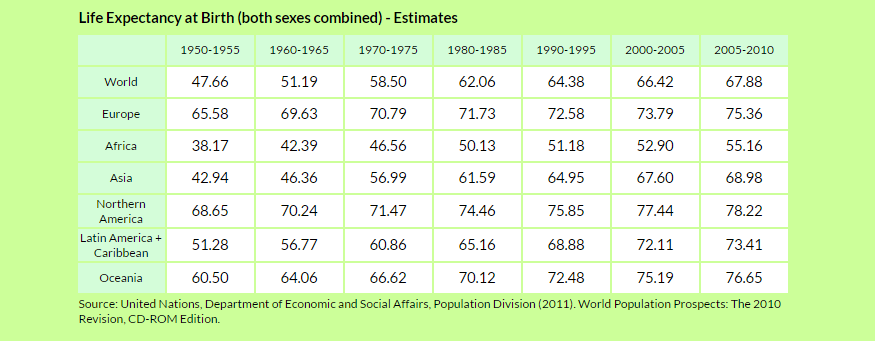
Task Seven: Life Expectancy
Plot the data on your worksheet, describe the trends, describe the patterns, try to explain the trends and then try and explain the patterns. Then read this related news article.
Plot the data on your worksheet, describe the trends, describe the patterns, try to explain the trends and then try and explain the patterns. Then read this related news article.
Task Eight: Natural Increase
Natural increase can be calculated by subtracting the death rate from the birth rate. Calculate it, plot the data on your worksheet, describe the trends, describe the patterns, try to explain the trends and then try and explain the patterns.
Natural increase can be calculated by subtracting the death rate from the birth rate. Calculate it, plot the data on your worksheet, describe the trends, describe the patterns, try to explain the trends and then try and explain the patterns.

Time to attempt an exam style question. Answer one of the following questions:
- Explain the differences in births in two contrasting geographical locations. [5 marks]
- Explain the differences in natural increase in two contrasting geographical locations. [5 marks]
- Explain the differences in mortality in two contrasting geographical locations. [5 marks]
- Explain the differences in fertility in two contrasting geographical locations. [5 marks]
- Explain the differences in life expectancy in two contrasting geographical locations. [5 marks]
